
Recidivism rates are down at county jail

Data from the county jail for the year 2018 is in and it’s good news: recidivism rates are down significantly. The reason why, though, remains something of a mystery.
Recidivism is the rate at which people return to jail, but it can be measured in several different ways. Last year, Tompkins County decided to start collecting recidivism data by focusing on rebookings and revocations (for more on that decision see Tompkins Weekly’s March 6 cover story, “County uses data to create opportunities”). Now, a year has passed and the county has numbers to share.
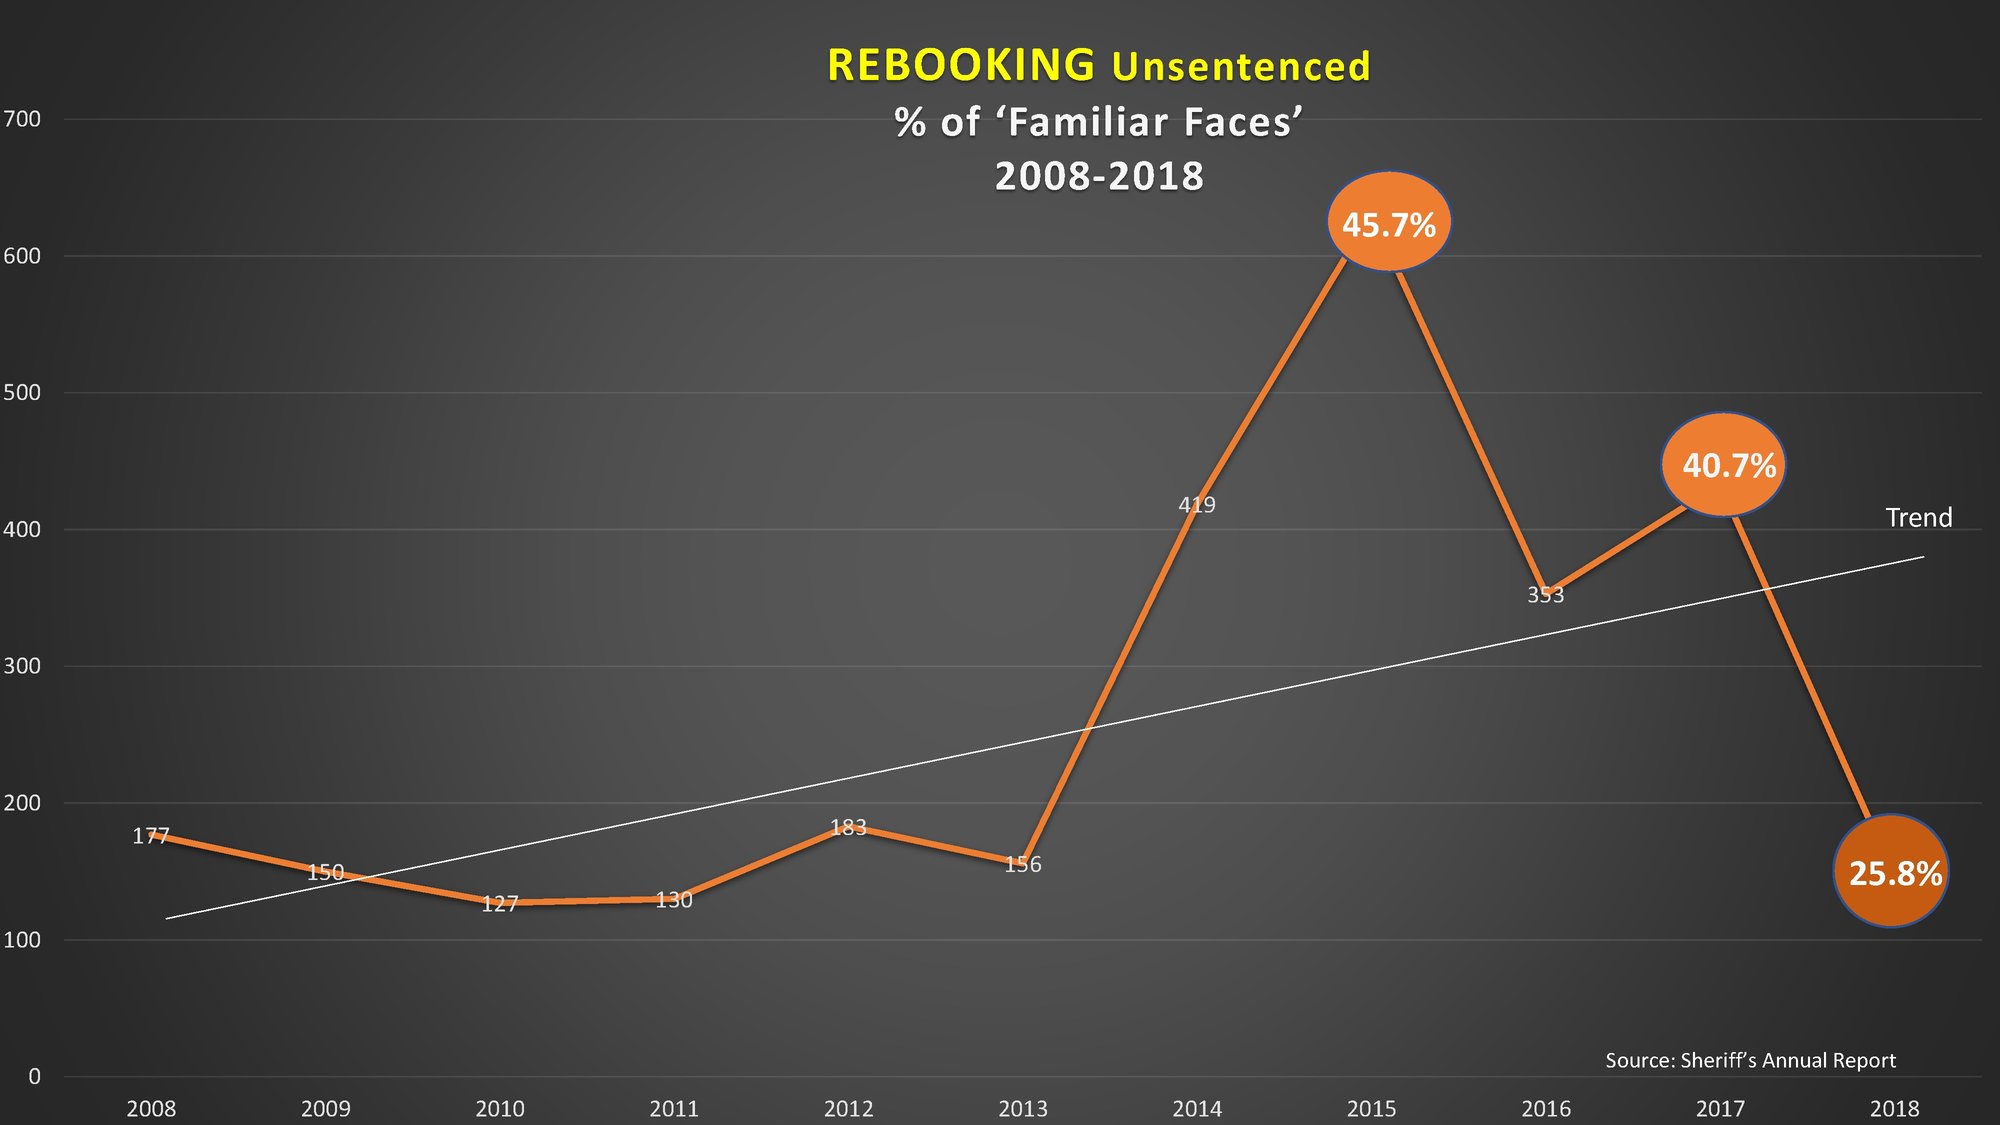
At a public meeting of the Criminal Justice and Alternatives to Incarceration (CJAI) committee meeting on March 27, Dave Sanders, Criminal Justice Coordinator for Tompkins County, laid out the data. In 2015, rebookings of unsentenced ‘Familiar faces,’ people who entered the jail more than once in a single year, was at 45.7 percent, which was a little over 600 people. In 2017 that number dropped to 40.7 percent, around 450 people. Last year’s numbers dropped to a dramatic low of 25.8 percent, around 150 people.
The drop is similar for rebookings of sentenced ‘Familiar faces’ as well. In 2014, recidivism was at 11.5 percent, last year it was at 2.7 percent.
But, as Sanders noted to those gathered at the CJAI meeting, the data the county currently has doesn’t explain what is bringing the numbers down. For several years the county has been investing in Alternative’s To Incarceration (ATI) programs and working with several organizations to address incarceration and recidivism rates at the county jail. For years the jail has been operating with too many beds with a waiver from the New York State Department of Corrections. But the NYSDOC told Tompkins County that waiver was no longer going to be allowed and it would have to figure out a solution.
After some talk of expanding the jail, or building a new one, pushback from the community helped convince the county to find alternatives. The Jail Task Force was created in the spring of 2014, just before the community began protesting the idea of a jail expansion. In 2016 the county commissioned a study to explore what steps could be taken across the criminal justice spectrum to lower the jail population, including addressing recidivism. These are just some of the dozens of things that can be considered factors for declining recidivism rates. Also included in Sanders presentation are: A new district attorney elected in 2017, Municipal Courts Task Force created in 2015, Felony Drug Treatment Court and City Drug Court, and various ATI’s beginning after receiving funding, among many others. What he included in the graph could be as low as one-tenth of the number of factors that have contributed, Sanders noted.
Last year, Sanders said he was gung-ho about measuring recidivism rates and getting those numbers. While collecting that data has been useful, he told the committee that he is less gung-ho about using it now as a goal.
“I think recidivism, like average daily census, is a great measure to say how we’re doing on a community level, I think it’s great for programs to understand so that when people aren’t successful, we try to identify the barriers to why they aren’t successful. But recidivism itself may not be the best measure.”
The model Sanders wants to use to continue to reduce recidivism has three pillars: identifying who to target with ATI programs and the risks they bring, identifying what needs to target with each person, and figuring out how to target those needs most effectively. It’s the same model used by parole officers.
Included in Sander’s presentation was data collected about the average daily census for the jail from 2008 to 2018 with a general decline. 2015 hit the high mark at 92, dropping to 80 in 2016, 76 in 2017, and a 10-year low of 72 last year. Compared to counties of a similar size, Tompkins County has a much lower daily jail census and has for many years. In 2018, St. Lawrence County had an average daily census of 162, while Ontario County had 139, and Steuben County had 189.
“All of the ATIs that we have implemented have contributed to decreasing our average daily census within the jail,” Sanders said.
One factor of the downward trend that Sanders noted in the meeting was the cost of board-outs from the jail. Back in 2013, the county was spending around $244,000 on board-outs. Close to one-quarter of $1 million is a lot of taxpayer money, which is one reason that investing in lowering the jail population became a higher priority. Last year, the county spent $68,420 on board-outs.
“We kind of understand, a little bit, that it takes multiple efforts to contribute to actually change an indicator on a community level,” Sanders said. “Nobody can take responsibility for it, but if your goal is to decrease that, you can say you contributed. That’s probably the best that we can do.”
Using data from the Sheriff’s Annual report, Sanders also calculated the length of stay for inmates in the jail over the last 10 years, from 2008 to 2018.
Indicators from this chart are also positive. His chart tracked three days or fewer, 12 days or fewer, 51 days or fewer, and 102 days or fewer. The number of admissions in every single category were at a 10-year low in 2018. A little over half of those admissions, 55 percent, were in for 12 days or fewer.
One of the areas that Sanders and the entire CJAI committee want to continue addressing is the length of time that parole violators stay in jail. As the population of the jail goes down, the percentage of parole violators goes up. Currently, that number is at eight percent of all admissions, and the average length of stay is 59 days. Parole violations have been on an upward trend in Tompkins County since at least 2003, according to Sanders data. The 2018 data shows that the jail saw 56 total parole violators.
As reported in the March 6 edition of Tompkins Weekly, Sanders and several dozen key players will be participating in a program to completely map the local criminal justice system to find gaps in coverage with the help of a grant from SAMSHA GAINS. But, Sanders surprised the committee when he announced that instead of just mapping two of the five main intercept areas, the mapping program would be covering all five areas: Community services, law enforcement, initial detention/initial court hearings, jails/courts, reentry, and community corrections.
Related Articles

Ulysses unveils first community park draft designs following public survey
Ulysses community park plans advance as residents review two draft designs created from survey feedback and Cornell collaboration.
Street Beat: Where is your favorite place to shop?
We asked five random people. Here’s what they had to say.

‘Weaponizing hunger’: County residents, nonprofits and officials brace for federal SNAP, Medicaid cuts
SNAP and Medicaid cuts may affect thousands in Tompkins County as demand for services rises.